During the summer of 2020, the Ghedin and Gresham labs at New York University sequenced several SARS-CoV-2 isolates from clinical samples acquired in New York City. To visualize and share the data among researchers and collaborators we built a JBrowse web server. JBrowse is a web-based genome visualization software allowing you to visualize your genomic data files, such as FA, VCF, BAM, CRAM, and GFF3 files.
To benefit all researchers at NYU engaged in genomics research, we have implemented a centralized JBrowse service at NYU’s CGSB at http://jbrowse.bio.nyu.edu/ for PIs and their lab members.
Features and Benefits
- Visually analyze your data in custom tracks
- Specific URLs for desired views to share with external collaborators
- Integration with the GATK pipeline on NYU HPC
For the most up to date documentation, click here.
We have integrated automated JBrowse visualization into existing gencore tools. For example, the results of the GATK pipeline , which performs alignment and variant calling, can now be automatically uploaded to the JBrowse site for immediate visual analysis. Within your nextflow.config file add the following lines to specify the data set name and the PI.
// JBrowse params
params.do_jbrowse = true
params.gff = "/scratch/work/cgsb/genomes/Public/Fungi/Saccharomyces_cerevisiae/Ensembl/R64-1-1/Saccharomyces_cerevisiae.R64-1-1.34.gff3"
params.jbrowse_pi = "Smith"
params.dataset_name = "project1"
Each data file generated by this workflow will result in a track that you can view and customize.
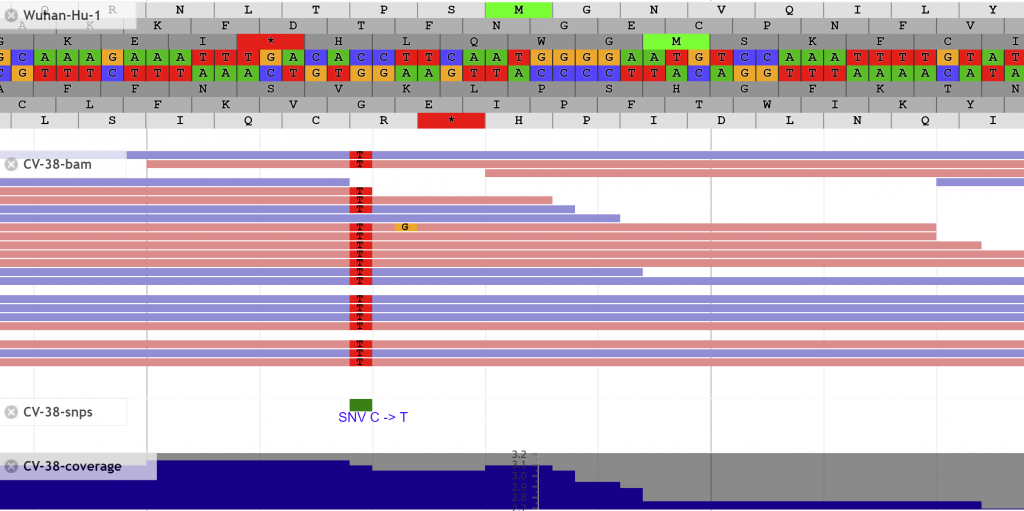
Search for features of interest with the search bar at the top.

The URL will dynamically change to meet your current selection of tracks, view, and highlights. You can then use this unique URL to share with colleagues or post in publications.
Getting Started
The first step is to establish a lab specific account and request access to your PI’s lab, here. This is different from Prince and requires approval by your PI. Just like the PI shared directories on the HPC cluster, your fellow lab members have the ability to modify or delete your data.
Once you have access you can upload data into a new or existing data set. On the Prince HPC cluster there is a single command cgsb_upload2jbrowse that can run to transfer and format the data. Outside the cluster a user can rsync the data manually.
USAGE: cgsb_upload2jbrowse -p PI -d DATASET [-f FOLDER] [-s SAMPLELIST] [FILES]
-----------------------------------------------------------------------------------------
-p | --PI                specify PI
-d | --dataset           specify data set
-f | --folder            specify folder containing files
-s | --samplelist        specify sample list for categorization
-----------------------------------------------------------------------------------------
File formats supported:
- fa
- fasta
- fna
- vcf.gz*
- bam*
- bam.bw
- cram*
- gff3.gz*
- gff

*Requires index file (tbi, bai, crai) of the same base name
Example 1:
To transfer your data within your scratch (/scratch/user/project1/data) that includes the reference data to Smith’s project1 data set run the following.
cgsb_upload2jbrowse -p Smith -d project1 \
 -f /scratch/user/project1/data  \
Example 2:
To transfer your data within your scratch (/scratch/user/project1/data) along with the reference data in the prince shared genome repository folders to Smith’s project1 data set run the following.
cgsb_upload2jbrowse -p Smith -d project1 \
 -f /scratch/user/project1/data  \
 /scratch/work/cgsb/genomes/Public/Fungi/Saccharomyces_cerevisiae/Ensembl/R64-1-1/Saccharomyces_cerevisiae.R64-1-1.dna.toplevel.fa \
 /scratch/work/cgsb/genomes/Public/Fungi/Saccharomyces_cerevisiae/Ensembl/R64-1-1/Saccharomyces_cerevisiae.R64-1-1.34.gff3
Example 3:
To transfer outside of the Prince cluster
# Transfer the files
rsync --progress -ruv /path/to/dataset/ <NYUnetID>@jbrowse.bio.nyu.edu:/jbrowse/<PI>/<DATASET>
# Build and publish the tracks based on the files uploaded
ssh <NYUnetID>@jbrowse.bio.nyu.edu addTracks --PI <PI> --dataset <DATASET>
The data will be accessible immediately on the JBrowse server. Choose your PI on the JBrowse homepage’s dropdown menu then the data set name that was specified in the previous step. Once accessed you will be able to display visualizations or tracks for each file. These tracks by default will be named after the file itself. You can find more information on customizing track names and appearance in the documentation online.
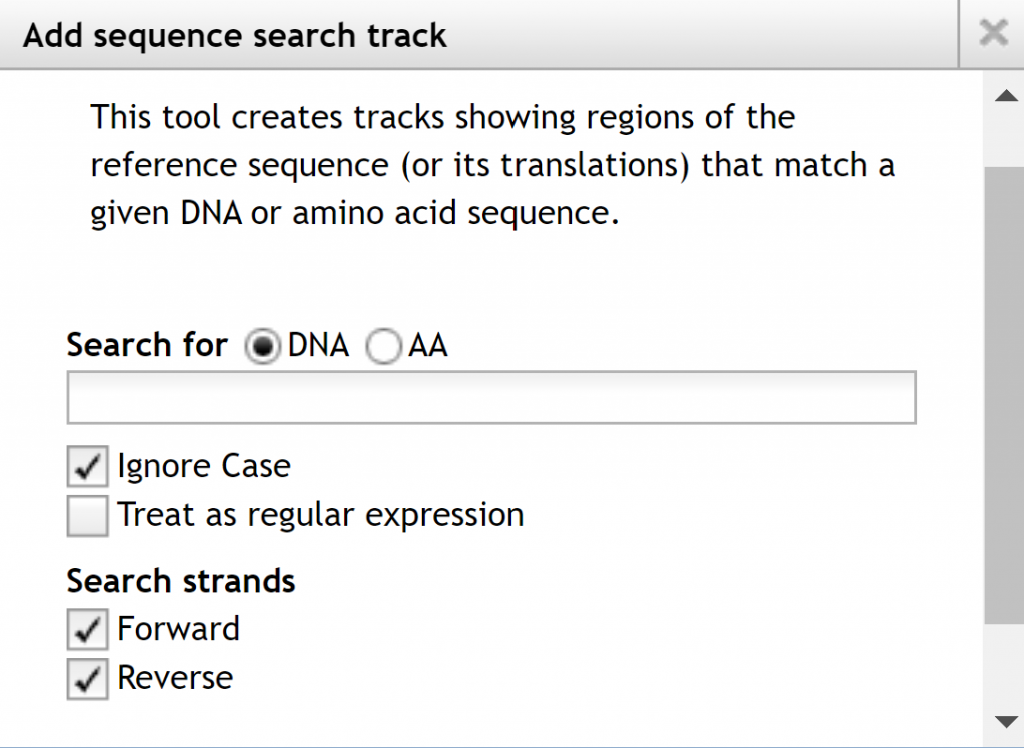
The available tracks will be selectable on the left allowing you to display only items of interest and their order displayed. If you go to the `Track` menu at the top of the page, you have two options to create a combination track combining 2 tracks or a sequence search track, which shows regions of the referenced sequence or its translations that match a DNA or amino acid sequence.


0 Comments