Gene Set Enrichment Analysis (GSEA) is a common method to analyze RNA-Seq data that determines whether a predefined defined set of genes (for example those in a GO term or KEGG pathway) show statistically significant and concordant differences between two biological phenotypes. There are a myriad of tools for GSEA analysis, and one of them which I particularly like is clusterProfiler. Developed as an R-based tool, clusterProfiler has until now been inaccessible to users unfamiliar with the R programming language. NASQAR, recently developed by the core bioinformatics team at the NYU Center for Genomics and Systems Biology, now makes clusterProfiler available as a web app with a simple UI, enabling anyone to use clusterProfiler and perform GSEA with GO Term and KEGG Pathway gene set data in minutes.
Getting Started
- Navigate to the GSEA app
- Click “Input Data”
- Upload a CSV file containing a list of gene names and log2 fold change values. This data is typically produced by differential expression analysis tool such as DESeq2*
* If you don’t have this data, you can run the DESeq2 app built into NASQAR to perform DE analysis (you’ll need to provide gene count data). Alternatively, you can use the sample data available in the app to follow along.
Parameters
Once your data is uploaded, you’ll need to select the appropriate columns in your CSV and set the following parameters before your data can be analyzed:
- Organism
- clusterProfiler supports all Org.Db annotation packages. See the list of available organisms here: http://bioconductor.org/packages/release/BiocViews.html#___OrgDb
- Key Type
- this is the source of the annotation (gene ids). This might be ENSEMBL, NCBI, ENTREZID, etc. Available options for your organism are available in a dropdown list to select from.
- Ontology
- GO Term ontology, one of “BP” (Biological Process), “MF’ (Molecular Function), “CC” (Cellular Component), or “ALL”
- Number of Permutations
- the higher the number of permutations you set, the more accurate your result will, but the longer the analysis will take (increased compute time).
- minGSsizeminimum
- number of genes in set (gene sets with lower than this many genes in your dataset will be ignored).
- maxGSSizemaximum
- number of genes in set (gene sets with greater than this many genes in your dataset will be ignored).
- pAdjustMethod
- one of “holm”, “hochberg”, “hommel”, “bonferroni”, “BH”, “BY”, “fdr”, “none”
Output
Once your results are ready you can visualize your enriched gene set data in various ways.
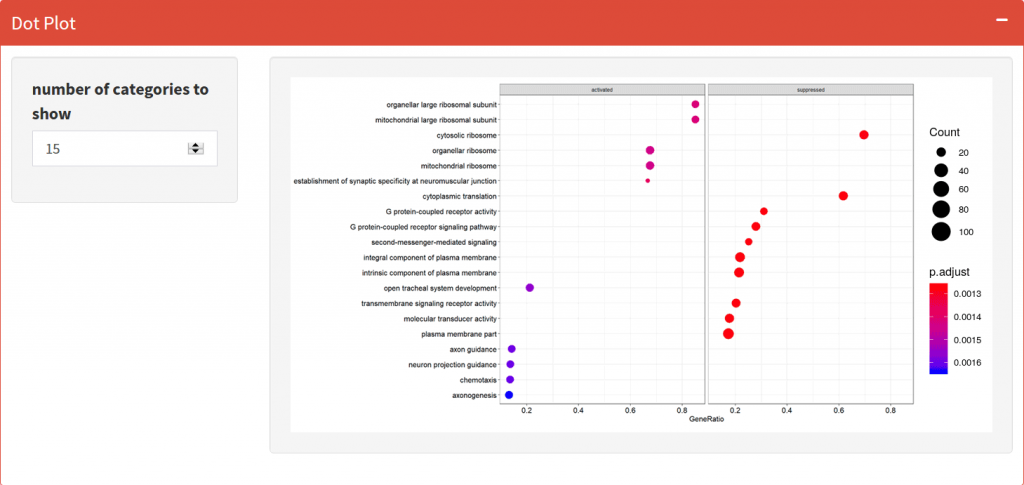
Dotplot
Visualize the top activated and suppressed enriched GO Terms or KEGG Pathways.
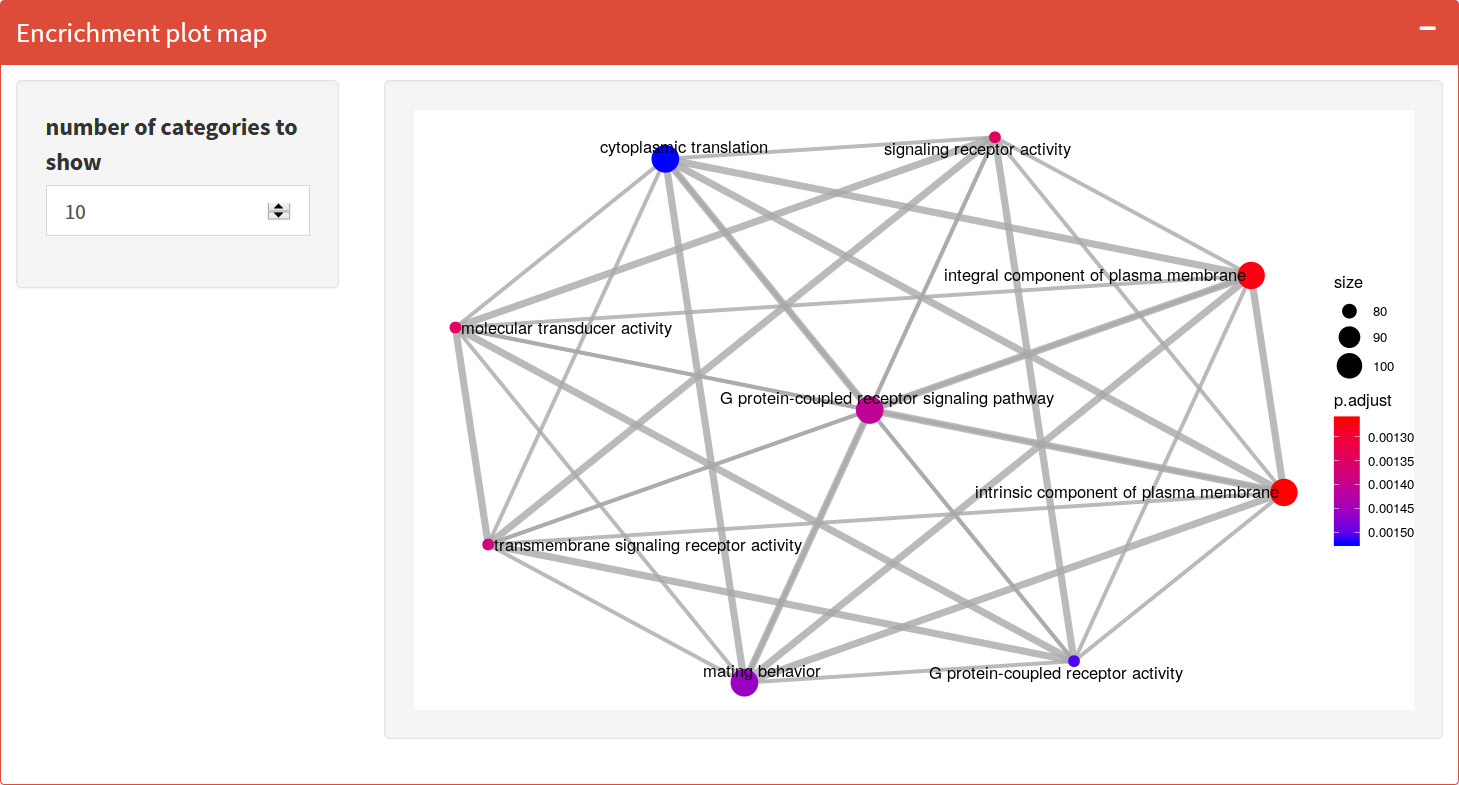
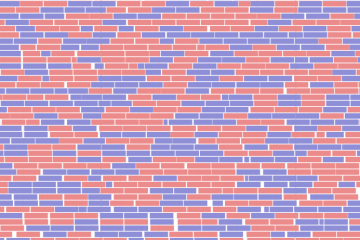
Enrichment Map
Organizes enriched terms into a network with edges connecting overlapping gene sets. In this way, mutually overlapping gene sets tend to cluster together, making it easy to identify functional modules.
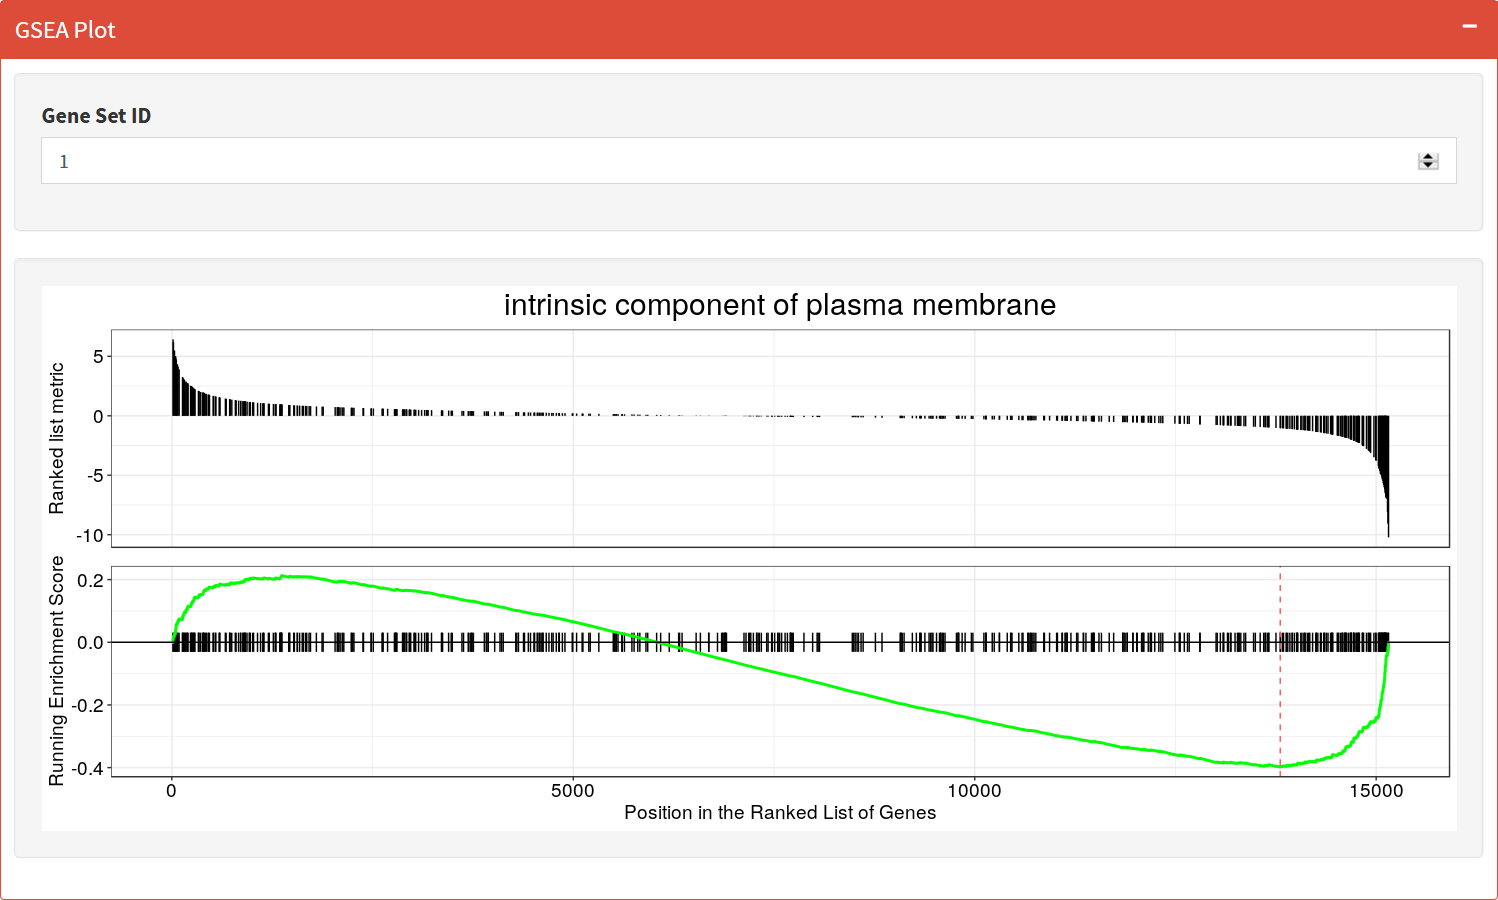
GSEA Plot
Plot of the Running Enrichment Score (green line) for a gene set as the analysis walks down the ranked gene list, including the location of the maximum enrichment score (the red line). The black lines in the Running Enrichment Score show where the members of the gene set appear in the ranked list of genes, indicating the leading edge subset.
The Ranked list metric shows the value of the ranking metric (log2 fold change) as you move down the list of ranked genes. The ranking metric measures a gene’s correlation with a phenotype.
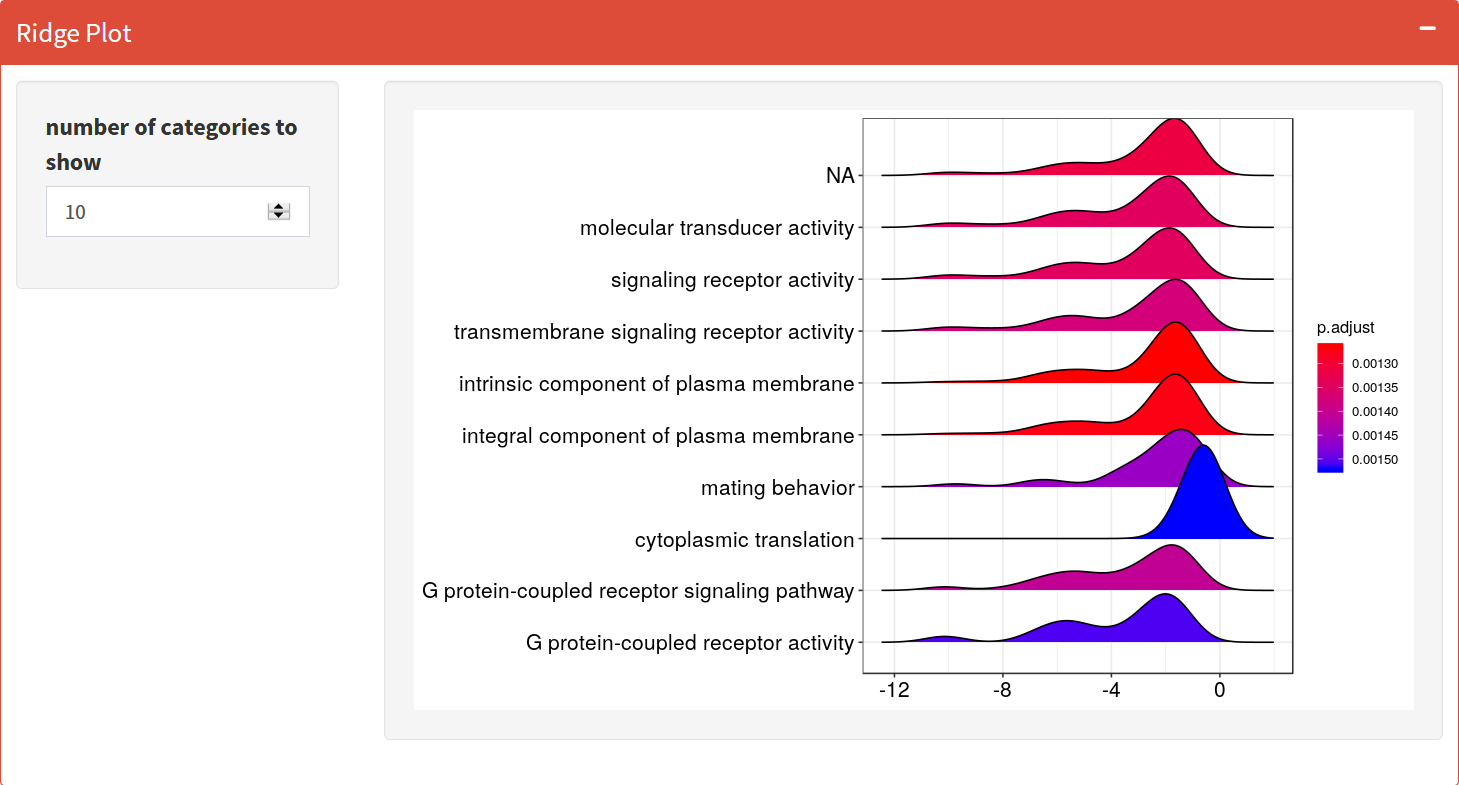
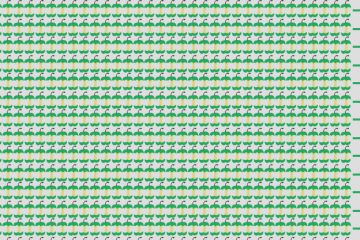
Ridgeplot
Grouped by gene set, density plots are generated by using the frequency of fold change values per gene within each set. Helpful to interpret up/down-regulated pathways.
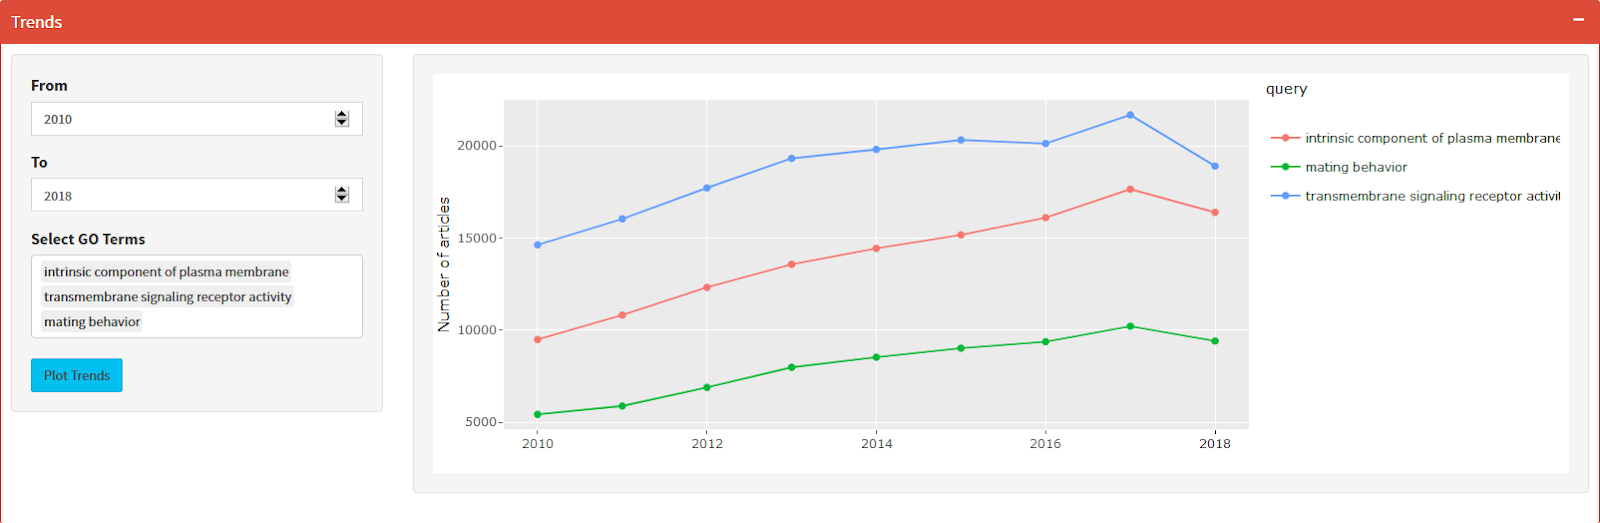
PubMed Trend of Enriched Terms
The number of publications per year based on the query result from PubMed Central.
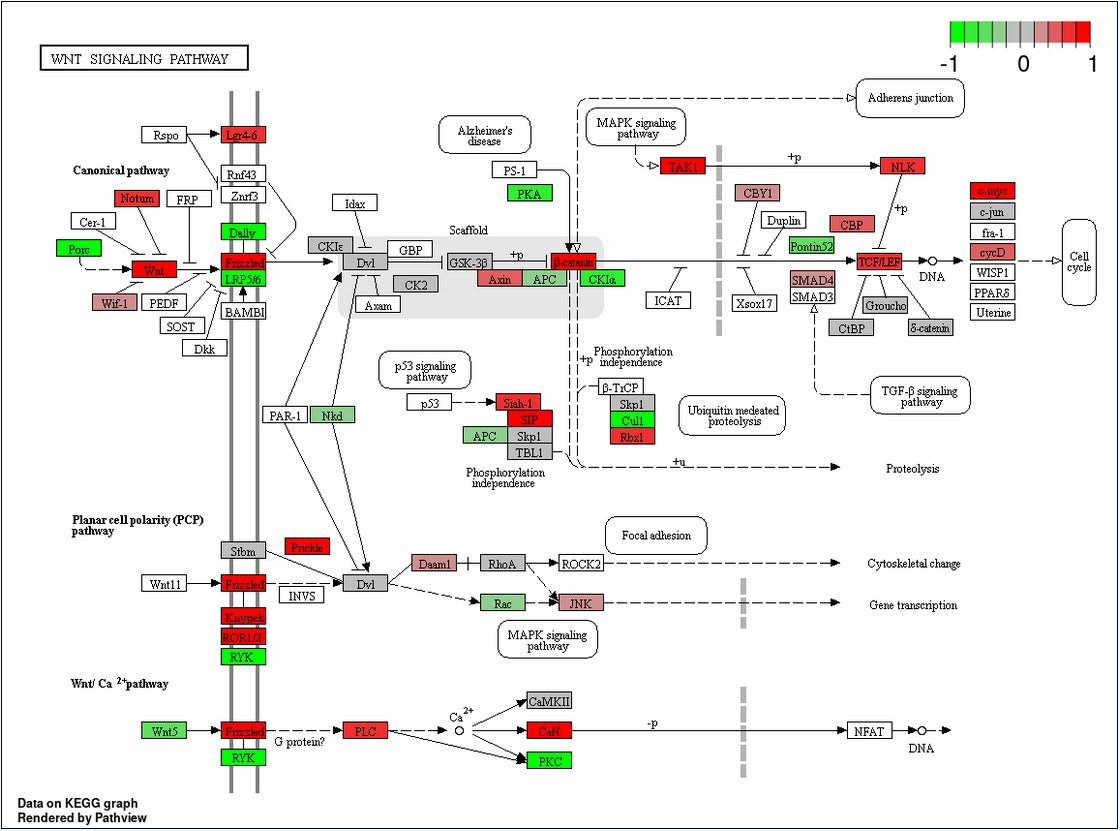
Enriched KEGG Pathway Plot
Summary
GSEA is a powerful and common analysis method for RNA-Seq experiments and is normally employed after differential expression analysis, for example when studying genes that are differently expressed under different conditions. NASQAR provides an intuitive interface that allows users to perform this analysis easily and efficiently.
Additional Material
If you’d like to learn how to use clusterProfiler in R, checkout this tutorial:
There’s also an app in NASQAR for over-representation analysis:
https://nasqar.abudhabi.nyu.edu/ClusterProfShinyORA/
Like the app? Let us know in the comments below.

0 Comments