Salmon and kallisto might sound like a tasty entree from a hip Tribeca restaurant, but the duo are in fact a pair of next-generation applications for rapid transcript quantification. They represent a new approach to transcript quantification using NGS that has a number of advantages over existing alignment-based methods. I’ve tried them both out and provide my thoughts below.
We are used to quantification methods that rely on full base-to-base alignment of reads to a reference, but newer methods leverage the idea that that when quantifying reads, the necessary information is not where in a transcript a read aligns, but only which transcripts could have generated the read. This idea renders base-level alignment, which has been the computational bottleneck until now, unnecessary for this analysis. Because this approach does not involve actual alignment to the genome, it is sometimes referred to as ‘pseudoalignment’.
kallisto
Pros:
- Extremely Fast & Lightweight – can quantify 20 million reads in under five minutes on a laptop computer
- Easy to use
- Sleuth – an interactive R-based companion for exploratory data analysis
Cons:
No support for stranded librariesUpdate: kallisto now offers support for strand specific libraries
kallisto, published in April 2016 by Lior Pachter and colleagues, is an innovative new tool for quantifying transcript abundance. kallisto uses the concept of ‘pseudoalignments’, which are essentially relationships between a read and a set of compatible transcripts. kallisto obtains highly accurate pseudoalignments efficiently using k-mers together with the transcriptome de Bruijn graph (T-DBG). Grouping of pseudoalignments belonging to the same set of transcripts into equivalence classes allows for a simpler model and more efficient use of underlying algorithms. The result is a tool which is able to quantify a paired-end library with 22 million reads in 3.5 minutes on a single-core with 8GB of memory.
Both kallisto and Salmon are magnitudes faster than Tophat + Cufflinks. Times computed on 22M read PE illumina dataset, 1 CPU core and 8GB memory.
Speed is great, but accuracy is critical. The plot below displays a high correlation (r = 0.941) between results obtained by kallisto and Cufflinks. You can see that the majority of differences are for transcripts with low expression levels.
kallisto is self-described as being ‘near optimal’. In this case, ‘optimal’ refers to two key aspects of the analysis: Speed and Accuracy. While the benchmark for accuracy can be determined by comparing results to a known “gold standard” data set or results from other existing tools, the benchmark for speed is typically based on how fast an input file can be read. A good way to measure optimal speed is to calculate how long it takes to read through a file, the linux word count (wc) utility provides a measure of this. For example, if it takes your machine 45 seconds to perform a word count on a set of reads, 45 seconds could be considered the benchmark for speed in quantifying this set of reads (on your machine). You can see in the plot below that kallisto is taking just over twice as long as it takes to read through the file. That’s not bad for a complex problem of quantifying RNA-seq data!
The linux word count (wc) utility can serve as a benchmark for ‘optimal’ speed.
A companion to kallisto, sleuth is an R-based program for exploratory data analysis powered by Shiny. The tools in sleuth allow you to investigate transcript abundance data or combine results from multiple samples for differential expression analysis. Interactive tools to explore scatterplots, volcano plots, MA plots, heat maps, PCA analysis, and more make analyzing your data faster and easier. For example, when examining a volcano plot, users can highlight a region of interest and immediately see a list of the transcripts selected in a table below.
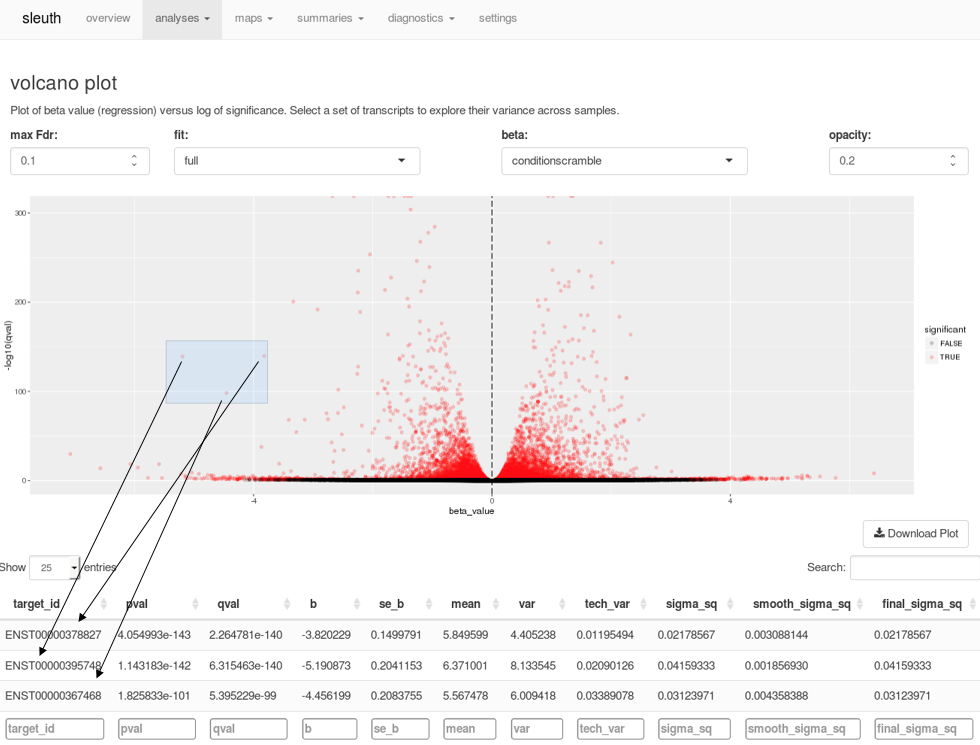
Selecting points on a volcano plot brings up the transcripts corresponding to those points in the table below, in real time.
Using the ID’s of the transcripts, users can drill down further and examine boxplots of transcript abundances to see technical variation in each sample and biological variation between conditions.
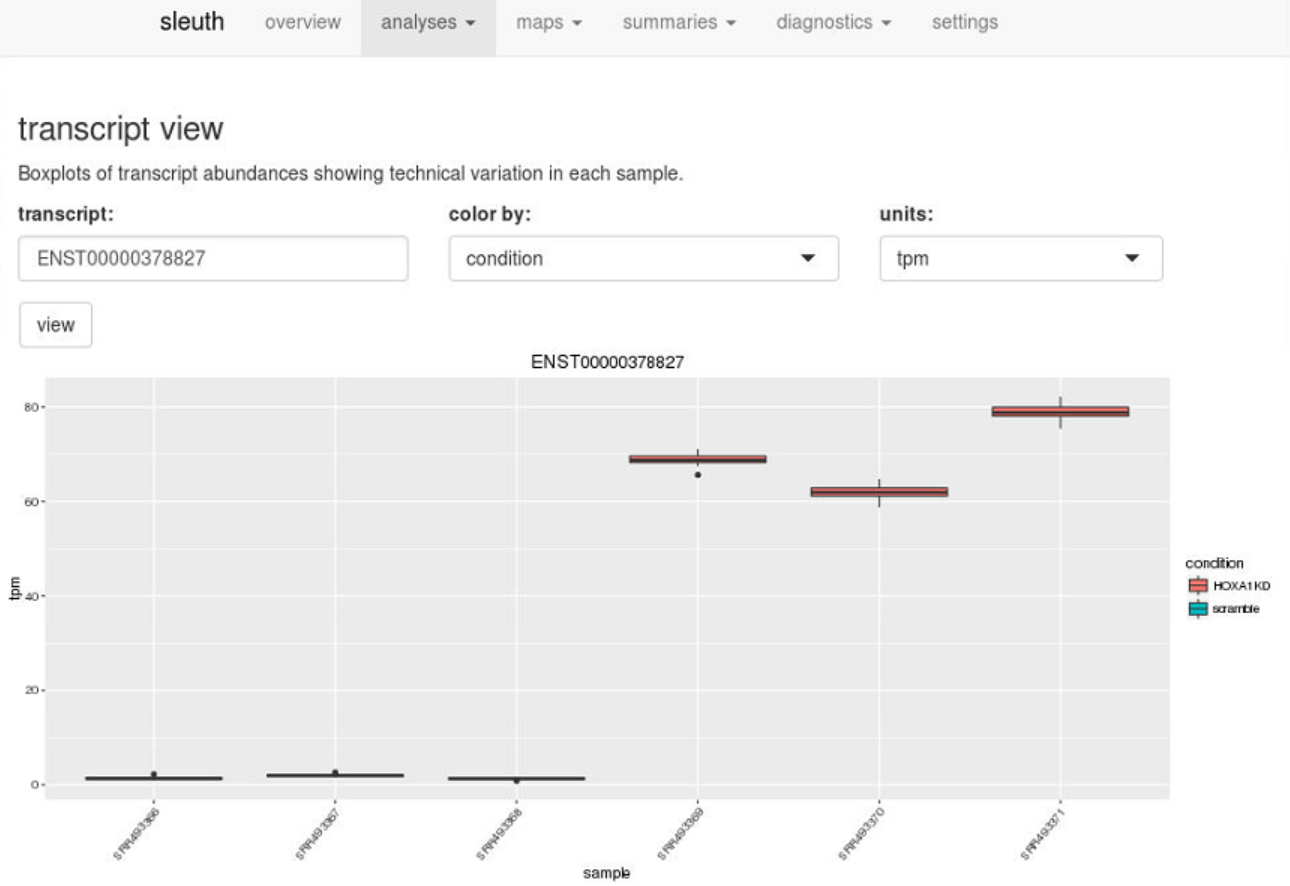
Enter a transcript ID in transcript view, or a gene ID in gene view, to visualize technical and biological variation quickly.
sleuth requires technical replicates for its analysis. In lieu of actual technical replicates, sleuth makes use of bootstrapped values which serve as accurate proxies. Bootstrapping here is the process of repeating the quantification analysis after resampling with replacement from the original data, in order to simulate random sampling associated with sequencing.
sleuth computes differential expression using a statistical model that combines variance information from biological replicates as well as bootstrapped technical replicates to estimate true biological variance. A test of sleuth on data simulated according to the DESeq2 model found that sleuth significantly outperforms other methods (ex: DESeq2, edgeR). A preprint is forthcoming.
The power of kallisto and sleuth lie in their speed and ease of use. A user can go from raw reads to analysis in minutes. As impressive as kallisto is, one major drawback is that its simplified model makes it unable to account for strandedness in reads. This seems like a major limitation given that most RNA-seq protocols generated stranded information.. If support for strandedness is a requirement for your analysis, check out Salmon below. Update: kallisto now offers support for strand specific libraries
Salmon
Pros:
- Fast & Lightweight – can quantify 20 million reads in under eight minutes on a desktop computer
- Support for strand-specific libraries
- Accepts BAM and FASTQ files as input
Cons:
- No automatic support for compressed input files
From the creators of Sailfish, Salmon (released but unpublished) is another rapid quantification tool which leverages k-mer based counting to produce, in Salmon terms, ‘quasi-alignments’. Although Salmon is not quite as fast as kallisto and lacks some features such as seamless support for compressed files, its strong point is its ability to learn and account for the effects of experiment-specific parameters and biases, including support for strand-specific RNA-seq data.
In the data set used, the correlation between results obtained by Salmon and Cufflinks (r = 0.939) is nearly identical to that between kallisto and Cufflinks (r = 0.941).
Another feature Salmon offers is the ability to quantify pre-existing alignments (from BAM files). This means that if you already have BAM alignments (or will need BAMs for other reasons), you can provide Salmon with these. If you don’t have BAM files, you can provide your reads in fastq format and Salmon will create the quasi-alignments ‘wicked-fast’, and then quantify them.
Finally, if you’re quantifying your data with Salmon and would like to use sleuth for downstream analysis, you’re in luck. The creators of Salmon have created an R library called wasabi which prepares Salmon (and Sailfish) output for use with sleuth.
The latest versions of Salmon, kallisto, sleuth, and wasabi are available for use on Mercer.
Getting Started (on Mercer)
kallisto
module load kallisto/intel/0.42.5
kallisto quant -i <kallisto_index> -o <output_dir> <read_1.fastq> <read_2.fastq>
To produce bootstrap values for downstream analysis with sleuth (in this example, 100 bootstraps):
kallisto quant -i <kallisto_index> -o <output_dir> -b 100 <read_1.fastq> <read_2.fastq>
sleuth
module load r/intel/3.2.2
module load firefox
R
>library("sleuth")
>base_dir<-(“/scratch/<netID>/kallisto-results/”)
The next step requires describing the experimental design and the relationship between the kallisto directories and the samples, which is variable depending on your experimental design and kallisto output structure. The final steps involve creating the sleuth object and performing the differential expression calculations, which take only a couple minutes in total to complete. Once these steps are complete, an interactive browser session can be launched. Please see Introduction to Sleuth for more.
Salmon
module load salmon/gnu/0.6.0
salmon quant -i <salmon_index> -l <lib_type> -1 <read_1.fastq> -2 <read_2.fastq> -o <output_dir>
In this example, we quantify a paired end, stranded library (where read 1 comes from the reverse strand), from Arabidopsis thaliana, with 100 bootstraps:
salmon quant -i A_thaliana_salmon_index -l ISR --numBootstraps 100 -1 read_1.fastq -2 read_2.fastq -o salmon_out
Resources
kallisto Paper:
http://www.nature.com/nbt/journal/vaop/ncurrent/full/nbt.3519.html
kallisto Manual:
http://pachterlab.github.io/kallisto/manual.html
Sleuth Blogpost:
https://liorpachter.wordpress.com/2015/08/17/a-sleuth-for-rna-seq/
Sleuth Tutorial:
https://rawgit.com/pachterlab/sleuth/master/inst/doc/intro.html
Salmon Preprint:
http://biorxiv.org/content/early/2015/06/27/021592
Salmon Manual:


1 Comment
Darach · 2016-06-30 at 11:09 am
Thanks for putting this up.